

As autumn leaves start to fall in Gainesville, the local real estate market is exhibiting its own seasonal shifts and trends. Whether you’re a potential homebuyer, a curious homeowner, or a savvy investor, understanding Gainesville’s real estate trends can be invaluable. In this update, we’ll dissect the latest numbers, uncovering insights and trends that could shape your next real estate decision in Gainesville. Let’s dive into the data and see what the market holds for us.
Deciphering Gainesville’s Property Pulse: Average vs. Median Sale Prices
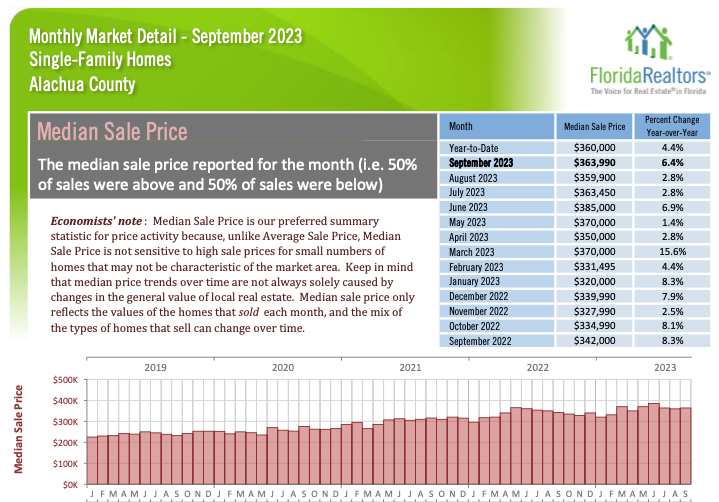
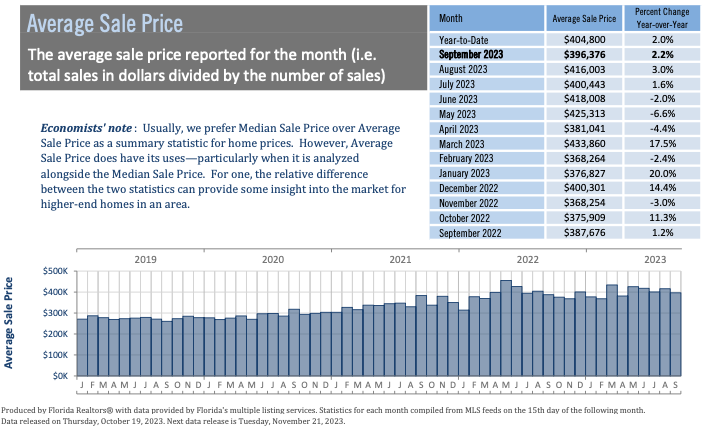
Have you tracked Gainesville’s real estate trends? This year, the average home sale price stands at $404,800, a 2.0% rise from last year. In September 2023, homes sold for an average of $396,376, marking a 2.2% increase from the previous September. While average prices are commonly discussed, experts often prefer the median sale price for a comprehensive view. Understanding the nuances between these can offer a competitive edge if you’re considering a market move.
Inventory Insights: Understanding Gainesville’s Market Dynamics and Seller Leverage
Transitioning from home prices, let’s explore Gainesville’s active listings. The year-to-date average inventory is 511 homes, a notable 15.9% jump from last year. In September 2023, 606 homes were listed, showing a 2.4% growth from last year. But what does ‘inventory’ mean? It’s not just new listings. It refers to the total homes available at each month’s end. Rising inventory suggests homes are being listed faster than they’re selling. For potential buyers, this means more options.
Yet, another vital metric to grasp is the Months Supply of Inventory (MSI). MSI estimates the duration the current inventory will last given the ongoing sales rate. This year’s MSI average is 2.1 months, a substantial 40% year-on-year increase. For context, a balanced market hovers around 5.5 months of inventory. Gainesville’s figures suggest a seller’s market, indicating higher demand than supply. In essence, sellers might have an upper hand in negotiations due to this high demand.
Buyer Behavior Shifts: The Impact of Rising Interest Rates on Pending Sales
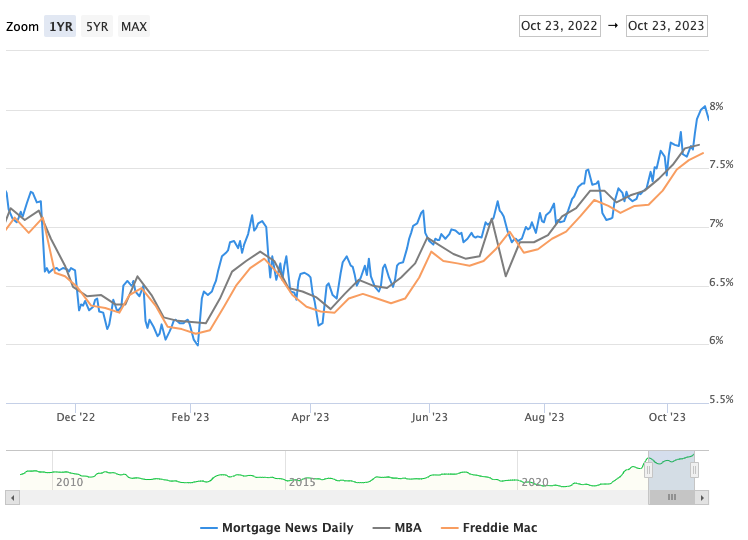
However, Gainesville’s pending home sales have declined by 15.5% year-to-date. Specifically, September 2023 saw a drop of 4.6%. Why? Interest rates above 8% have made buyers more judicious. Unwilling to settle or navigate inspection issues, they often exit deals that don’t align perfectly with their desires. Although pending sales can indicate potential future sales, they don’t always lead to closed deals. Given Gainesville’s dynamic market, both buyers and sellers must strategize effectively.
Timing Matters: How Seasonality and Market Rhythms Influence Sale Speeds
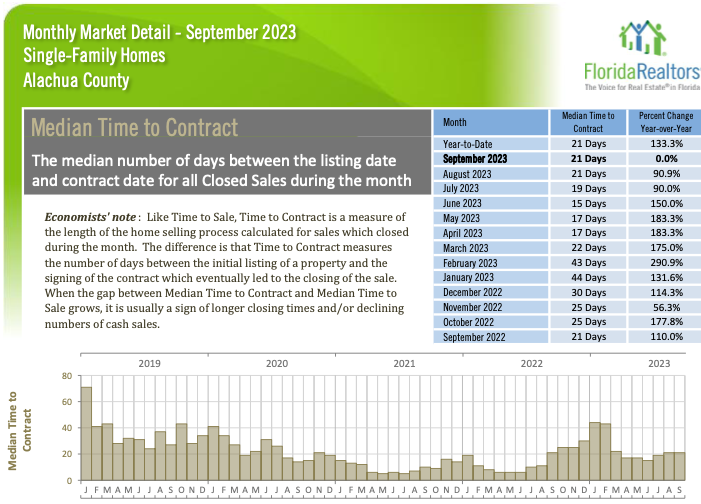
When gauging the pace of the real estate market, two pivotal metrics come into play: the Median Time to Contract and the Median Time to Sale. As of this year, properties in Gainesville are taking a median of 21 days to go under contract, a notable uptick of 133.3% compared to the previous year. On the other hand, the median time between a property’s listing and its final sale is standing at 65 days, showing a 22.6% increase year-over-year.
But here’s a crucial point to remember: real estate is inherently seasonal. Just as nature has its rhythms, so does the housing market. Factors like school schedules, holidays, and even the weather can influence buyers’ and sellers’ motivations and timelines. It’s not just about listing a property and watching the clock; it’s about understanding when and how the market ebbs and flows.
As a potential buyer or seller, keeping an eye on Gainesville’s real estate trends and these timelines can provide a clearer perspective on the market’s pulse, ensuring that you’re strategizing your moves with the most current insights at hand.
Charting Your Property Path: Personalized Guidance in a Dynamic Market
With the ebb and flow of Gainesville’s real estate market, it’s essential to have a seasoned guide by your side, translating these statistics into actionable strategies tailored for you. Every individual’s property journey is unique, influenced by personal goals and market dynamics. Don’t let the numbers overwhelm you; instead, reach out to me. As your trusted real estate agent, I’m here to provide clarity, offer insights, and develop a tailored plan to ensure your real estate aspirations become a reality. Let’s embark on this journey together and make your property dreams come true.
For more details watch this Gainesville Market Update